AP Precalculus · Lesson 2.7

Semi-Log Plots

How it works

Taking the logarithm of positive outputs turns an exponential model into a linear relationship. A straight pattern on a semi-log plot supports exponential growth or decay. The slope depends on the logarithm base.

y=abx ⇒ log⁡10y=log⁡10a+xlog⁡10by=ab^x\ \Rightarrow\ \log_{10}y=\log_{10}a+x\log_{10}b

Worked examples

Example 1

For y=10⋅100x\displaystyle y=10\cdot100^x, write the equation for log⁡10y\displaystyle \log_{10}y.

It is log⁡10y=1+2x\displaystyle \log_{10}y=1+2x.

Example 2

A semi-log plot has equation log⁡10y=2+0.3x\displaystyle \log_{10}y=2+0.3x. Recover y.

Exponentiate: y=102+0.3x=100(100.3)x\displaystyle y=10^{2+0.3x}=100(10^{0.3})^x.

Problems

Problem 2.7.1

At inputs 0,1,2,3\displaystyle 0,1,2,3, outputs are 1,10,100,1000\displaystyle 1,10,100,1000. Find their base-10 logs and describe the semi-log pattern.
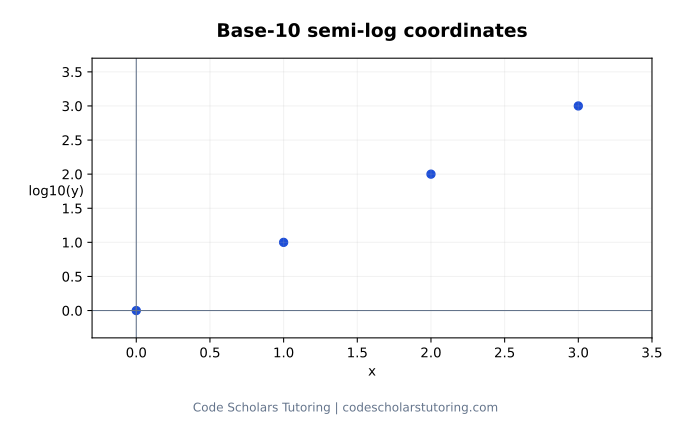
Points 0,0; 1,1; 2,2; 3,3 on axes x and log base 10 of y.
The original outputs are 1, 10, 100, and 1000.
Show worked solution

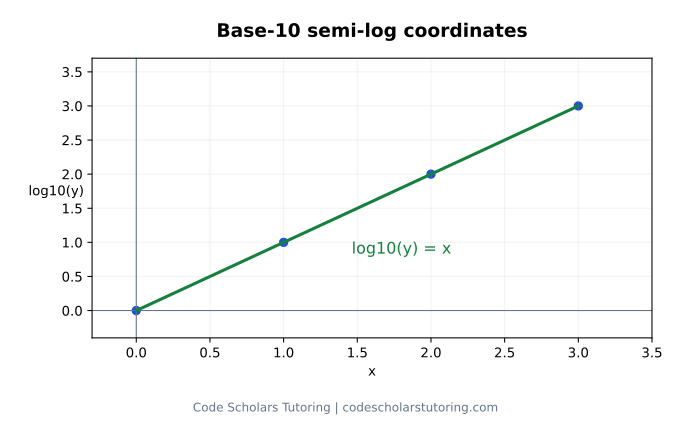
The log outputs are 0,1,2,3\displaystyle 0,1,2,3, so the semi-log points lie on the line log⁡10y=x\displaystyle \log_{10}y=x.

Points 0,0; 1,1; 2,2; 3,3 on axes x and log base 10 of y. The solution adds labeled relationships.
A straight line in these coordinates represents y = 10 to the power x.

Problem 2.7.2

Can a real semi-log plot use an output of 0\displaystyle 0?

Show worked solution

No. The logarithm of zero is undefined in the real numbers.

Problem 2.7.3

If ln⁡y=3−0.2x\displaystyle \ln y=3-0.2x, find the per-unit factor in the original model.

Show worked solution

Exponentiating gives y=e3(e−0.2)x\displaystyle y=e^3(e^{-0.2})^x, with decay factor e−0.2≈0.8187\displaystyle e^{-0.2}\approx0.8187.

Need help with this topic?

Work through questions with a tutor and get help with the steps you find difficult.

Get help with this topic